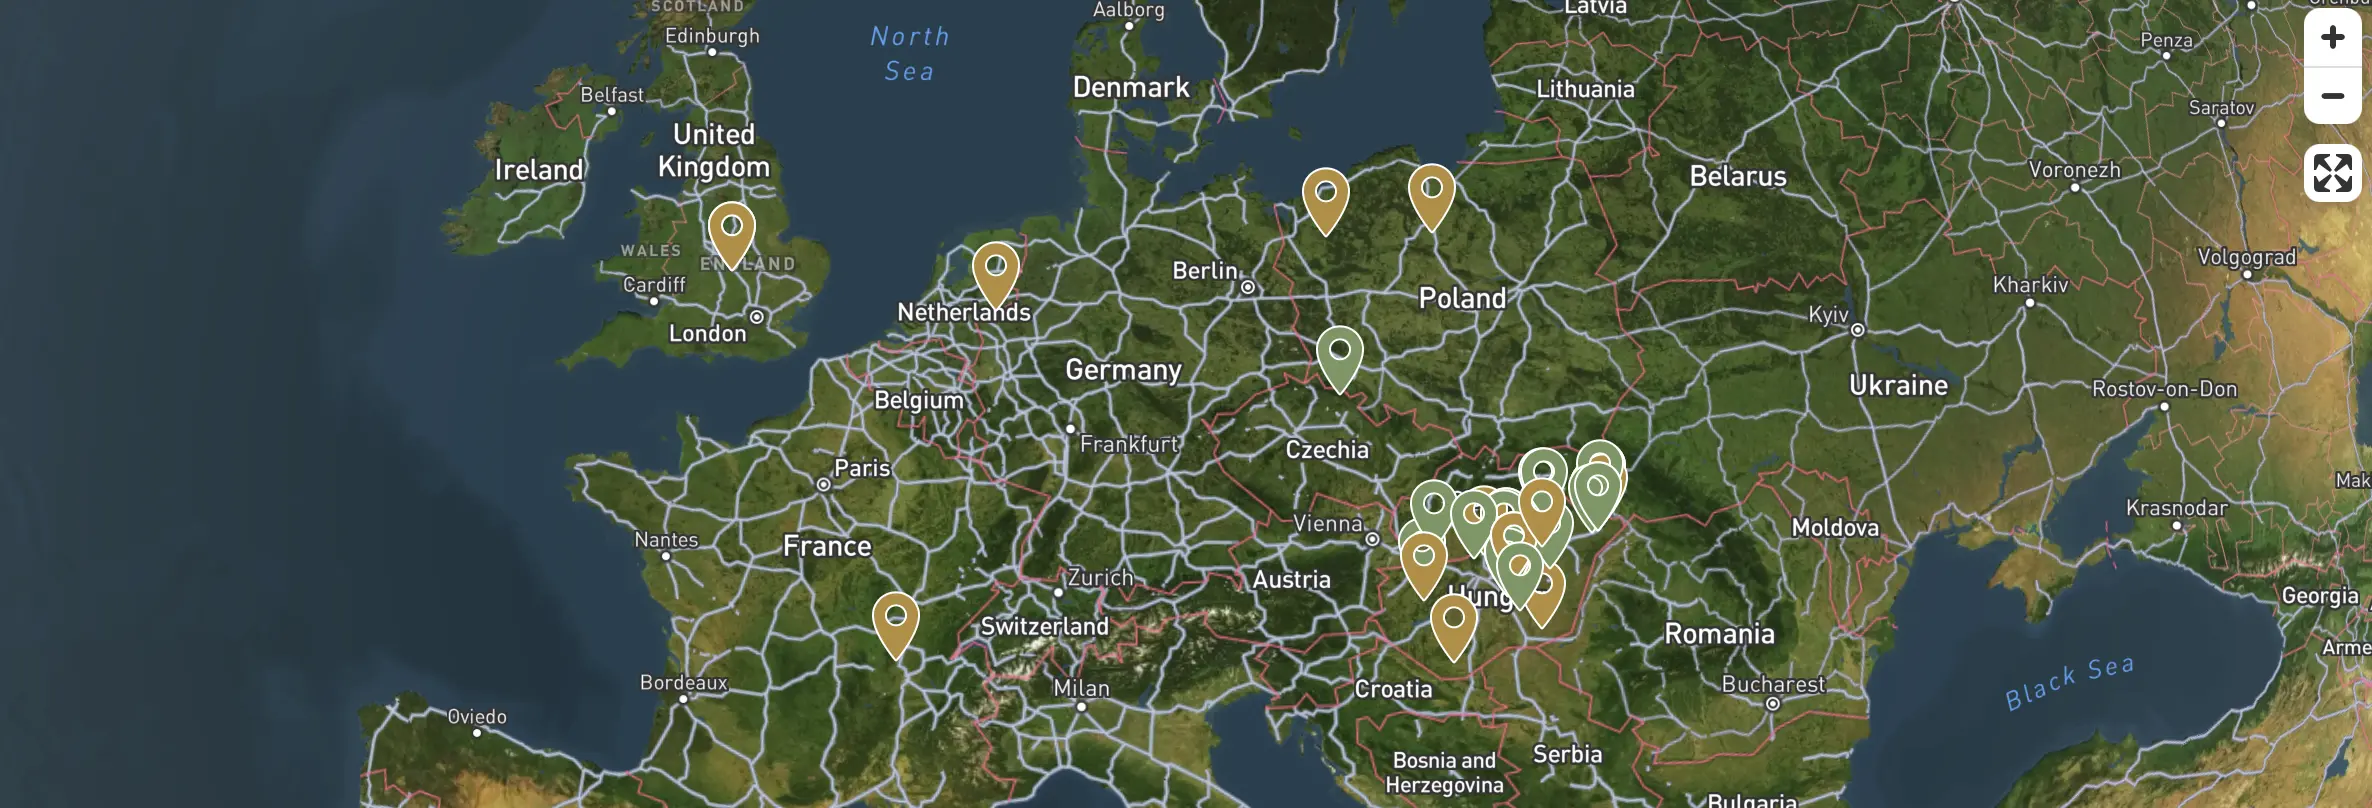
Projects on Map
The TreeDetect map view allows users to see the geographic location of all their projects.
Each project is represented on the map by an interactive marker, colour-coded to indicate its current status.
Features
-
Automatic placement:
The system places every project on the map based on its specified coordinates. -
Interactive markers:
Clicking a marker displays the project name, status, creation date, and a direct link to the project details. -
Zoom / Pan:
The map is fully interactive — zoomable, pannable, and viewable in full-screen mode. -
Synchronised status colours:
Projects appear on the map with the same colours used in list and card views, so users can quickly identify each project's status.
✅ Advantage
The map view provides a spatial overview of where different surveys are taking place and what stage they are at.
Colour Codes and Indicators
| Colour | Status | Meaning |
|---|---|---|
| 🟡 | Planning | The project is still in the preparation phase. |
| 🟤 | Processing | Uploaded data is being processed. |
| 🟢 | Report ready | Processing is complete and results are available. |
| 🔴 | Error | An issue occurred during processing. |