Report Page
Once the project processing is complete, the system automatically sends an email notification.
The report page provides a comprehensive display and export of the data produced after processing.
Here you can access detailed results, charts, heat maps, and the interactive map view where the parameters of individual trees can be examined.
Summary
The main indicators of the processing results appear in an overview block.
This contains all important forestry metrics, such as:
- Stem count
- Number of measured trees
- Total gross volume
- Average height
- Average diameter
- Average crown diameter
- Total basal area
- Volume per hectare
- Basal area per hectare
- Average stem count per hectare
- Average basal area
- Species
These data are available in both metric and imperial systems.
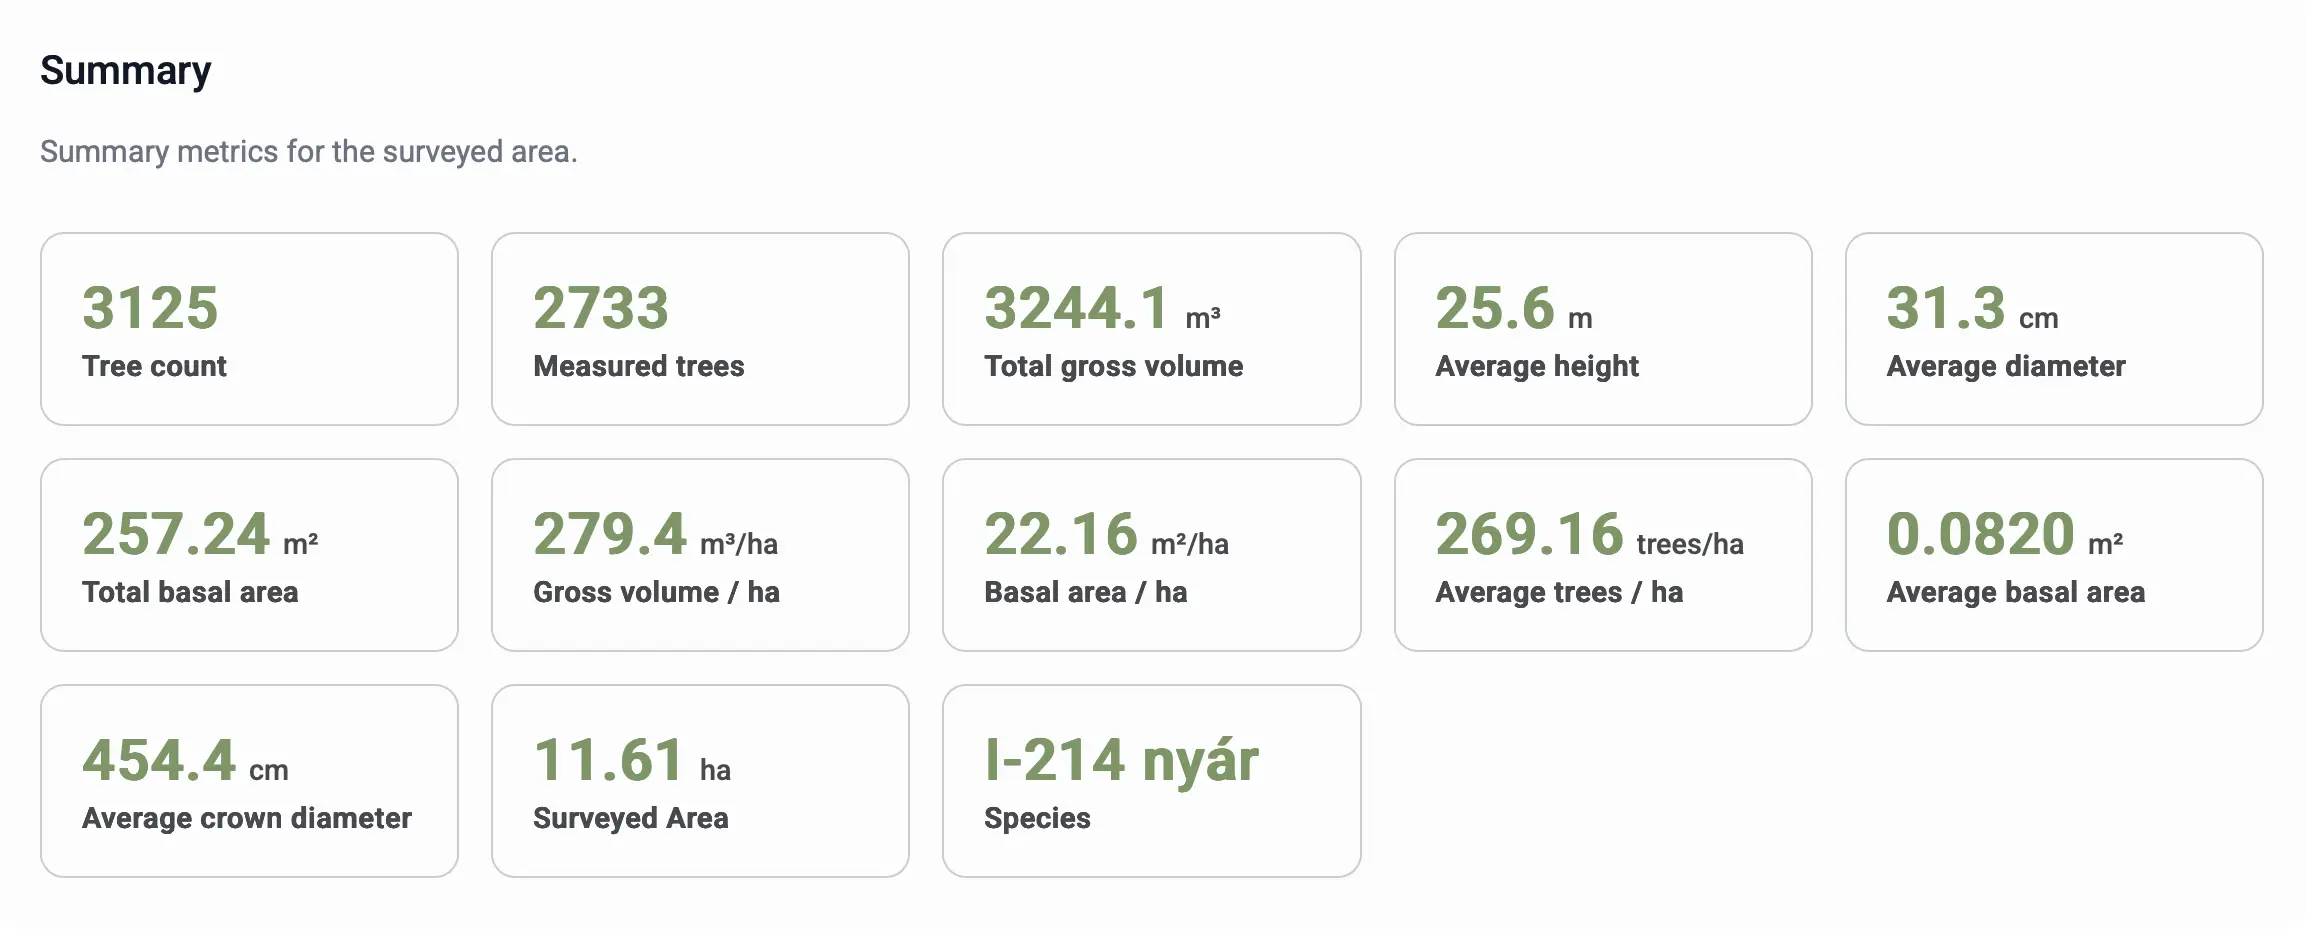
✅ Advantage: the summary provides an immediate picture of the structural characteristics of the area and the magnitude parameters of the stand.
Visualisations
The system automatically generates spatial and statistical visualisations that can be explored interactively.
Heat Maps
Heat maps show the structural changes of the area.
- Tree height heat map: shows the spatial distribution of trees by height.
- Trunk diameter heat map: illustrates the spatial distribution of tree diameters (D1.3).
- Crown diameter heat map: depicts the distribution of crown sizes on a color scale.
All heat maps are interactive, zoomable, and based on the color scale, spatial variation (e.g. denser, taller or shorter stand parts) is immediately visible.
Distribution Charts
Distribution charts show statistical correlations and structural characteristics.
- Tree height distribution: the distribution of trees by height categories.
- Trunk diameter distribution: the frequency distribution of diameters.
- Height and trunk diameter relationship: the correlation between the two parameters (displaying average, median, and trend lines). Here you can set how many sample pieces you want to see on the graph to get a clearer picture.
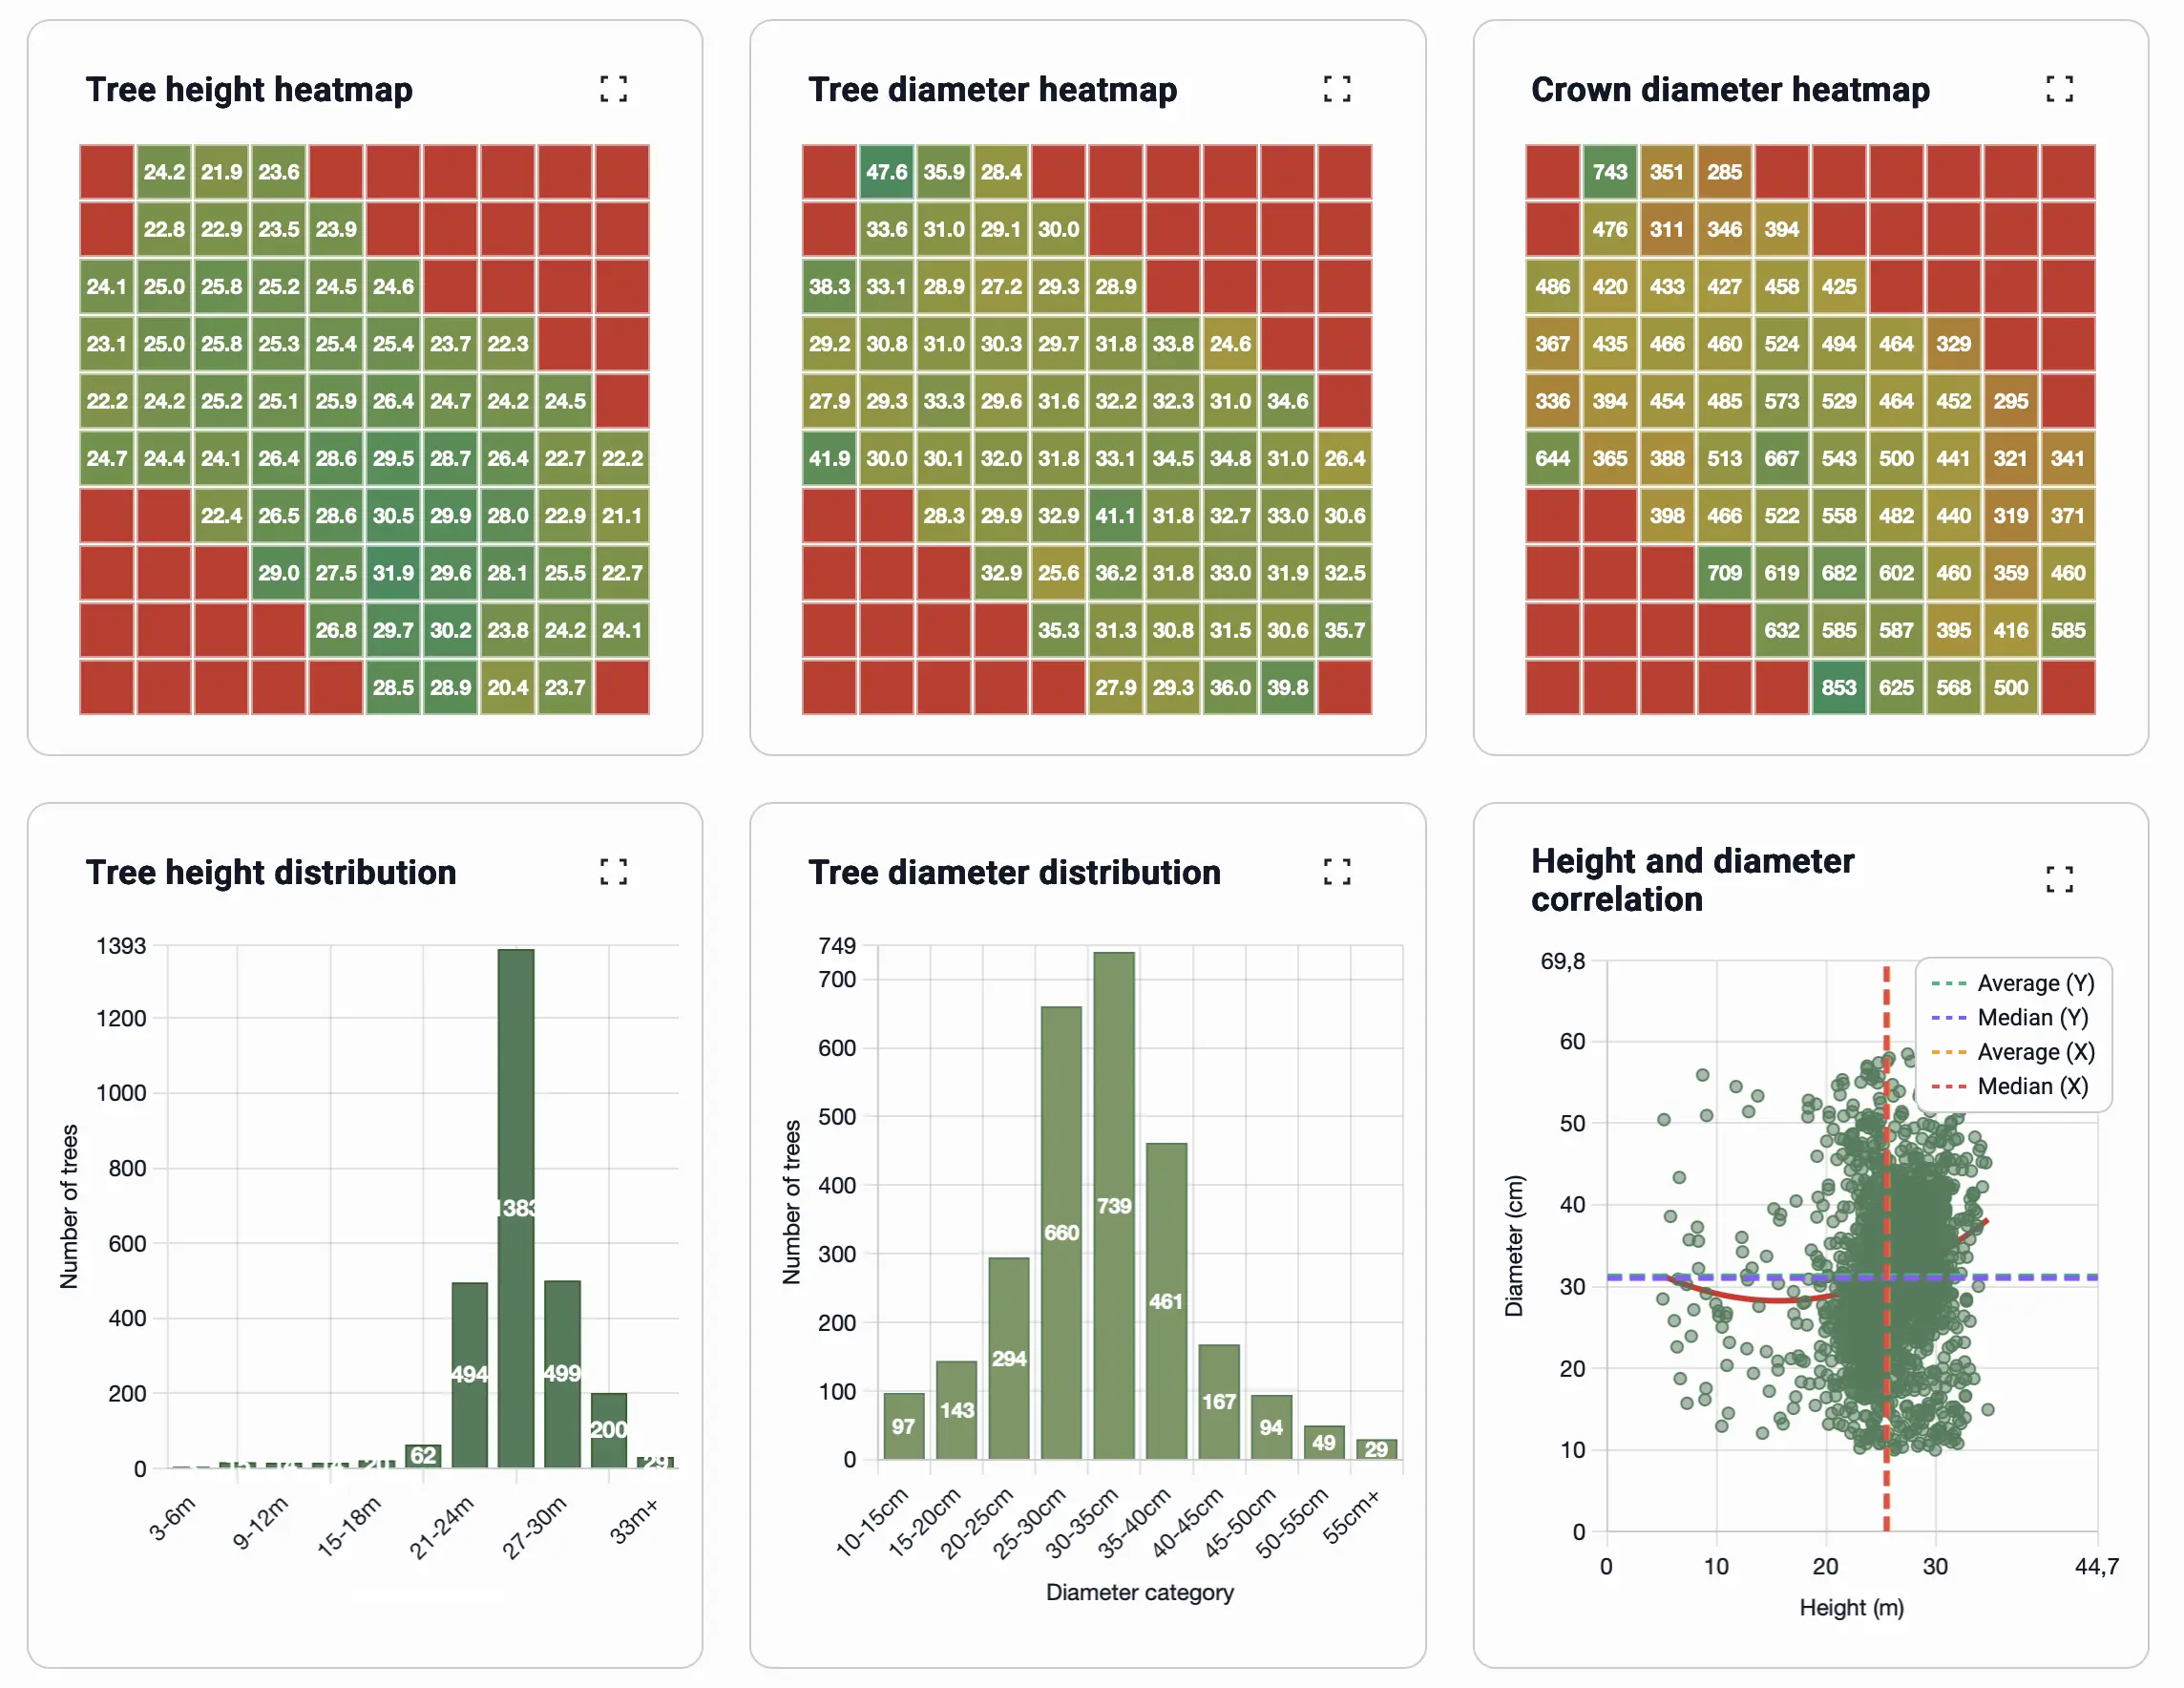
✅ Advantage:
The distribution charts help in understanding the heterogeneity, age distribution, and structure of the stand.
Every chart can be zoomed out to full view, and the values are dynamically updated based on the processed data.
Map View
The "Tree locations on map" module contains an interactive map displaying all detected and measured trees. The trees are color-coded:
- Blue: Measured tree
- Orange: Detected tree
In addition, the crown diameter is visibly displayed around the measured trees.
The map is interactive, zoomable, and movable. In the background, various layers such as DTM, CHM, or orthophoto can be selected.
Clicking on any point opens an information window where the parameters of that tree can be viewed:
- ID (Identifier)
- Height
- Diameter
- Crown Ø (Crown diameter, for measured trees only)
- Gross volume
- Basal area
For measured trees, a "View Tree" button is also available in the information window, allowing the point cloud of that individual tree to be opened separately and viewed in a 3D rotatable way.
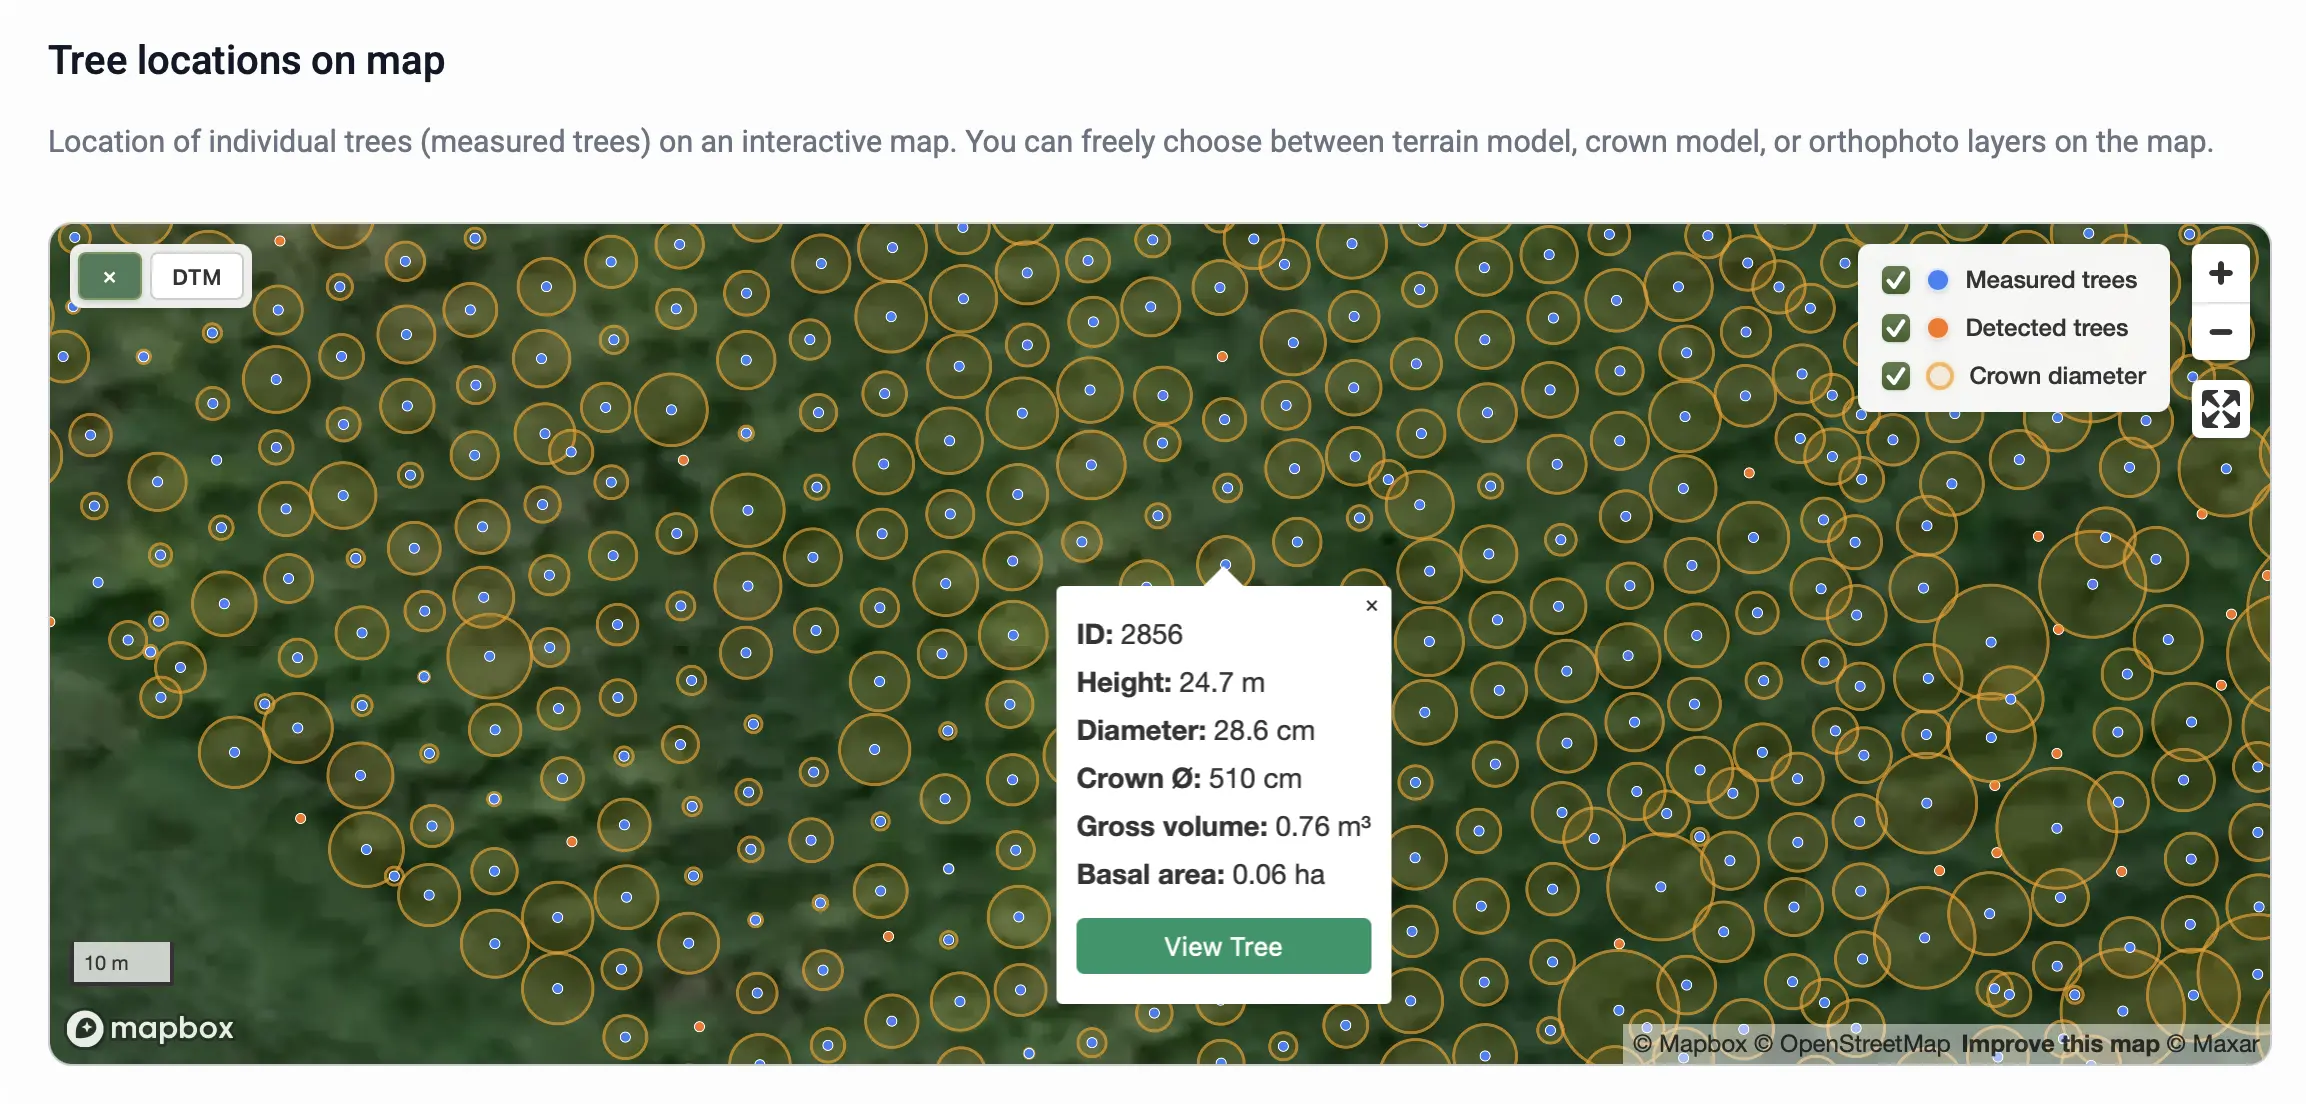
✅ Advantage:
The map module shows real spatial relationships, so the distribution of trees and the structural pattern of the stand can be accurately seen.
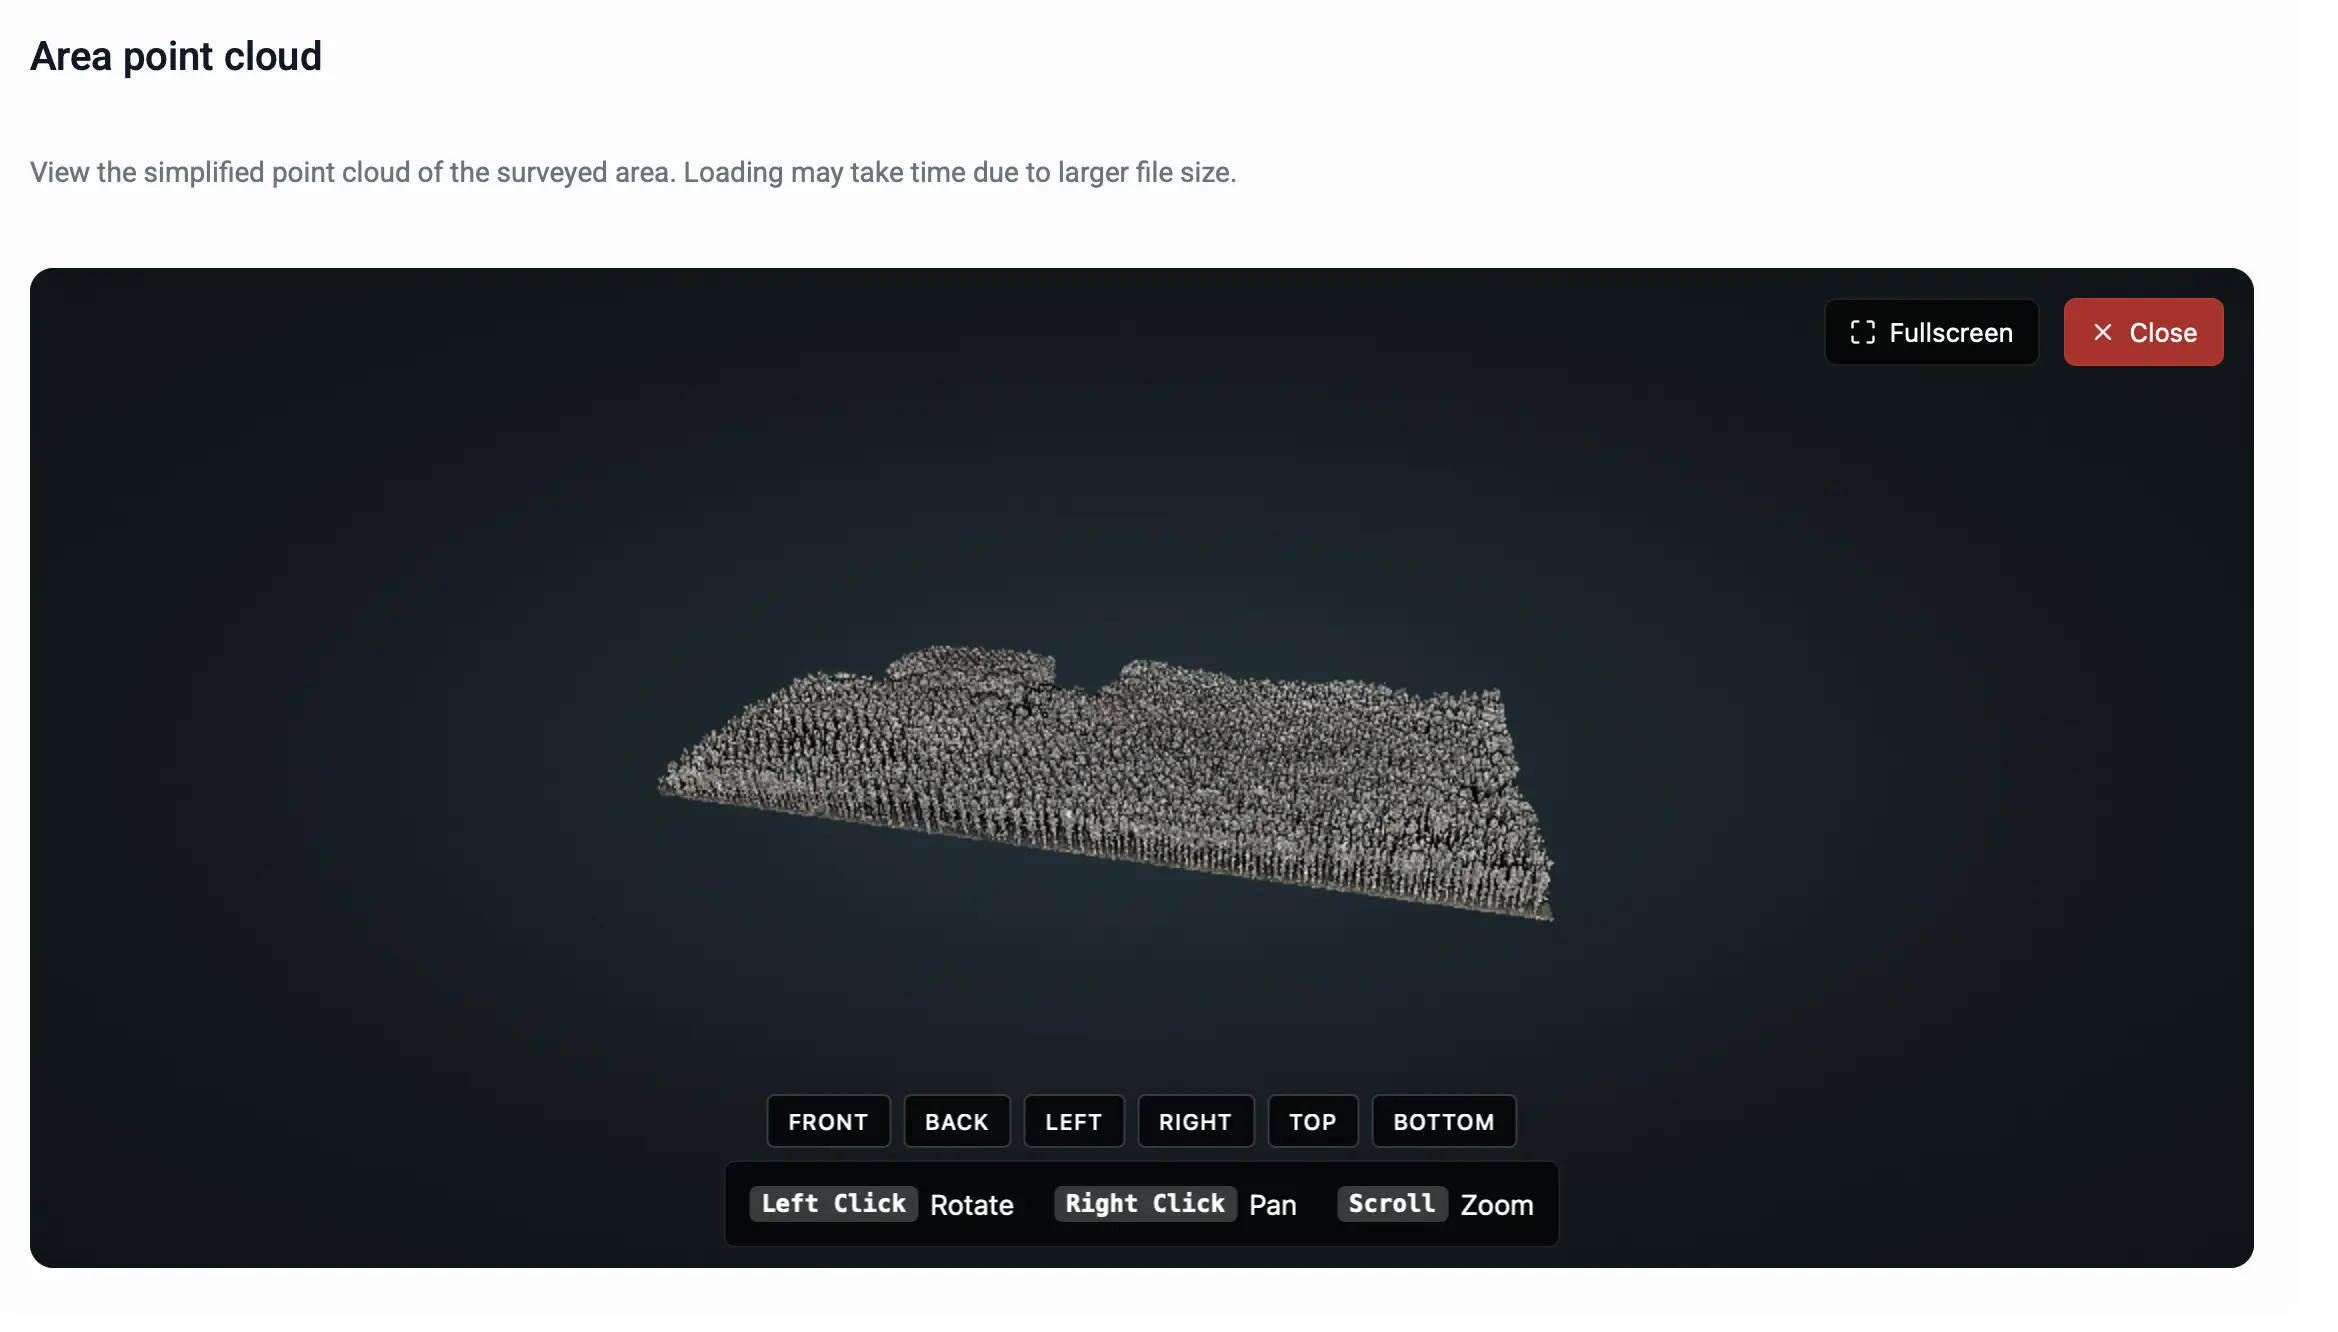
3D Point Cloud Viewer
In addition to downloadable files, an online viewer is available where the point cloud of the entire surveyed area can be viewed in 3D, in a rotatable format. It is important to note that for faster browser performance, only a simplified point cloud is displayed in the online viewer. The software uses a much more detailed and denser point cloud in the background to perform the measurements.
Downloadable Files
All processed layers and reports of the project can be downloaded.
Available Files
-
Layers:
projectname_CHM.tif, canopy height model
projectname_DTM.tif, digital terrain model
projectname_ORTHO.tif, orthophoto -
Report files:
projectname_REPORT.xlsx, detailed data table (with the parameters of every tree)
⚠️ Warning:
It is recommended to use GIS software (e.g. QGIS or Google Earth Pro) to open the high-resolution TIFF files.
Structure of the data table
The downloaded XLSX report file projectname_REPORT.xlsx contains the measured and calculated data for each tree. The table uses exclusively metric units (cm, m).
Explanation of the columns:
| TreeID | X | Y | Error | H | D_measure | D | Crown_Diameter | Volume | Basal_area | Detected_trees | Species | Area |
|---|---|---|---|---|---|---|---|---|---|---|---|---|
| Unique identifier of the given tree. | Geographical longitude of the tree (WGS84). | Geographical latitude of the tree (WGS84). | Trunk fitting error in meters. | Height of the tree in meters. | Position of the diameter measurement (default: 1.3 m). | Diameter at breast height in centimeters. | Crown diameter at the widest point, in cm. | Gross volume based on the tree species and formula. | Size of the basal area calculated from the trunk diameter. | Total number of trees detected in the area. | The tree species specified in the project. | Size of the area in hectares. |
Example rows:
| TreeID | X | Y | Error | H | D_measure | D | Crown_Diameter | Volume | Basal_area | Detected_tree | Species | Area |
|---|---|---|---|---|---|---|---|---|---|---|---|---|
| 1 | 19,66455 | 46,83322 | 0,0042 | 9,104 | 1,3 | 50,92 | 214 | 1,37914 | 0,203642 | 3125 | Poplar I-214 | 11,61 |
| 11 | 19,6643 | 46,83322 | 0,0019 | 21,580 | 1,3 | 28,2 | 493 | 0,660395 | 0,062458 | |||
| 12 | 19,66432 | 46,83332 | 0,0011 | 21,500 | 1,3 | 46,16 | 445 | 1,885149 | 0,167348 |
Generating Report
A "Generate PDF Report" button is available on the report page, which allows you to download a beautifully edited, professional PDF document.
This report contains all the important data, charts, and statistics of the entire project in a single clear report.
As the first step of report generation, you can select which parameters of the project you want the report to include. (Here you can select all available parameters of the project.)
✅ Advantage:
The PDF report is well-structured, clearly formatted, and print-ready, making it excellent for creating reports, studies, or official documentation.
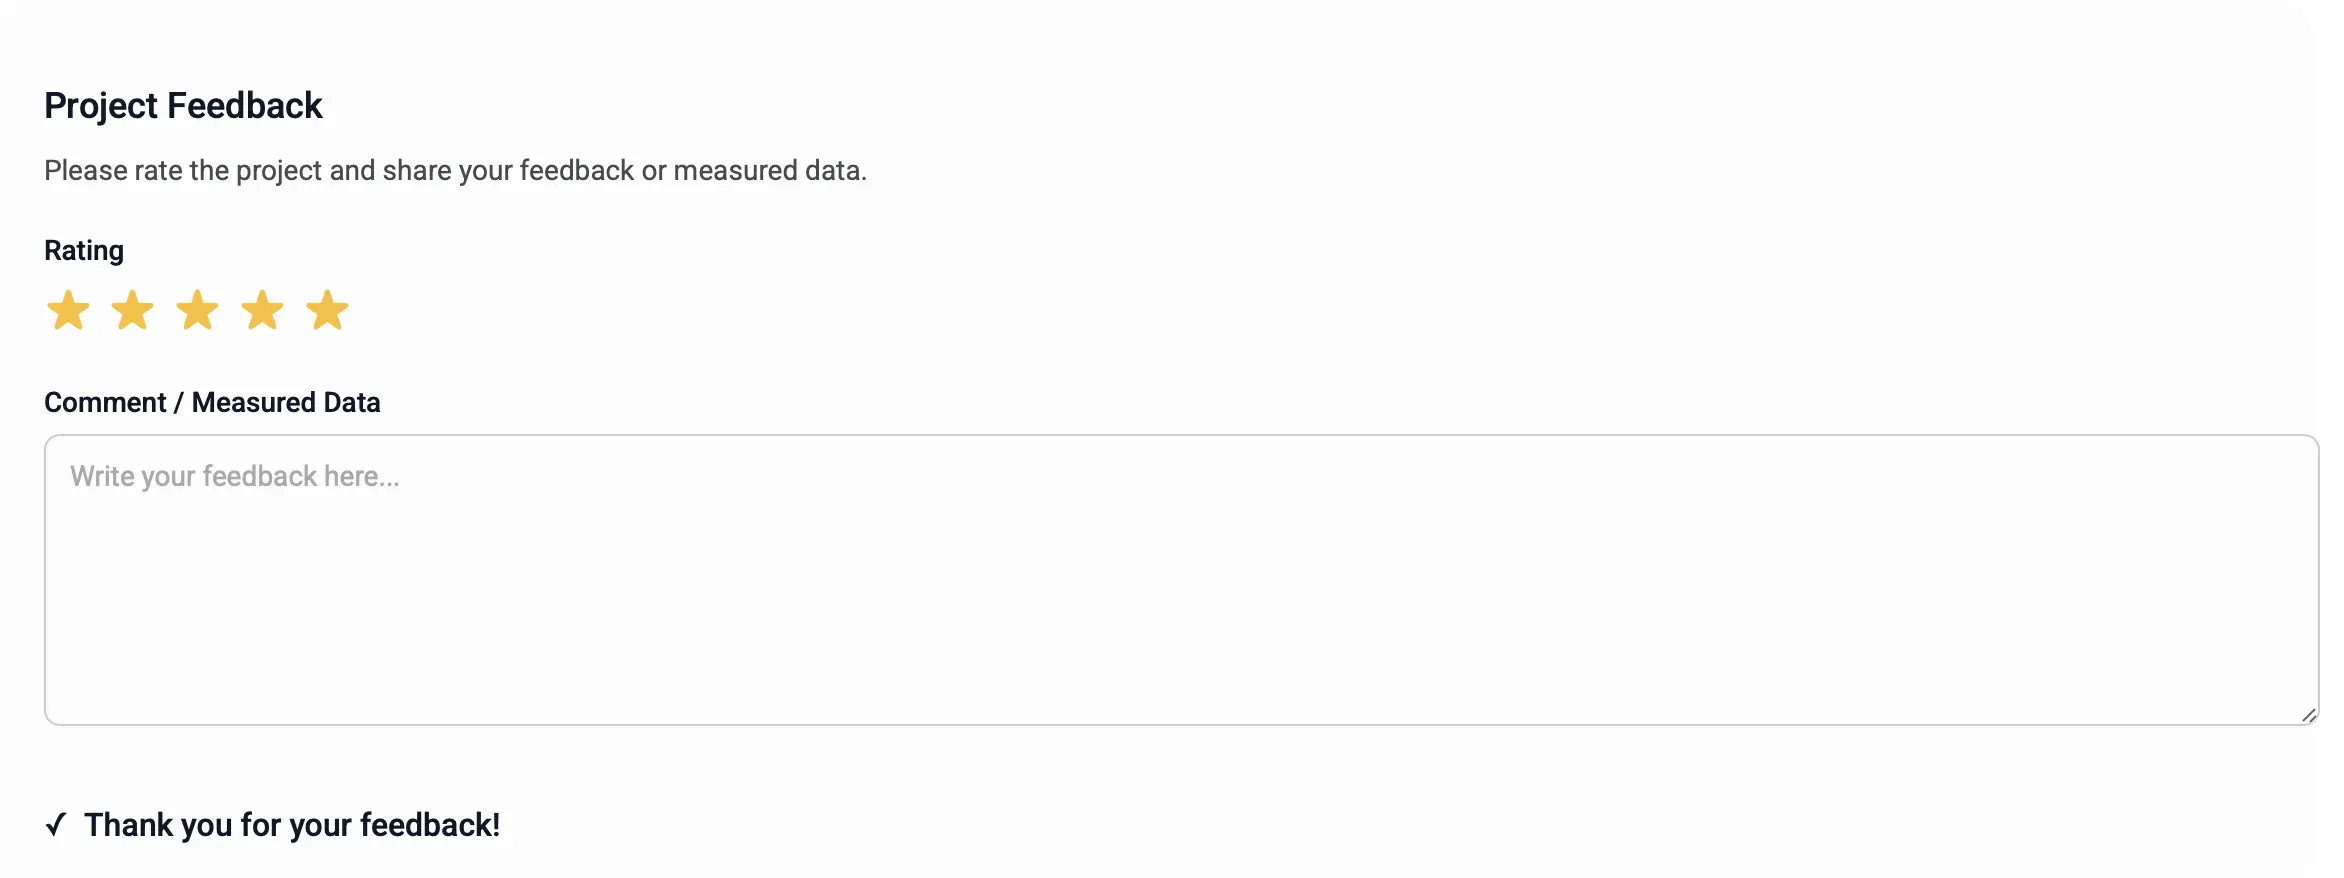
Feedback
At the very bottom of the report page, it is possible to provide feedback about the given project and the results obtained. It can be rated with stars, and a textual opinion can also be provided.
✅ We thank you for all feedback, as they help in the continuous development of the system!