Complete Tree Inventory
The TreeDetect complete tree inventory service aims to individually identify and measure every tree in the designated area based on uploaded LiDAR or photogrammetric data.
The system provides accurate, coordinate-referenced, measurable data for every tree, enabling both stand-level and individual tree analysis.
⚠️ Warning!
With photogrammetric processing, a complete tree inventory can only be produced accurately in leaf-off conditions. During the growing season, the canopy obscures trunks, which prevents precise determination of diameter at breast height. However, with LiDAR surveys (depending on the sensor), accurate measurements can be performed even in leaf-on conditions.
How It Works and Data Sources
The tree inventory can be produced from two types of data sources:
-
LiDAR-based processing:
The software identifies trees from the point cloud and measures their parameters. -
Photogrammetric processing:
The system first generates a 3D point cloud from drone imagery, then identifies trees and their parameters in the same way.
What Does the System Measure?
TreeDetect automatically performs the most important forestry measurements and identifications for every detected tree:
| Measured Parameter | Description |
|---|---|
| TreeID | Unique identifier for every tree |
| X, Y coordinates | Geographic location of the tree (in WGS84) |
| Fitting error (Error) | Average deviation from the fitted trunk cylinder during diameter measurement |
| Height (H) | Total tree height from ground level |
| Diameter at breast height (D1.3) | Trunk diameter at 1.3 m height |
| Crown diameter | Diameter of the tree's crown |
| Volume | Total gross timber volume (using the chosen calculation method) |
| Basal area | Cross-sectional area calculated from the diameter at breast height |
| Species | The tree species specified in the project (based on user input) |
| Area | Size of the processed area in hectares |
| Detected tree count | Total stem count identified in the project |
Volume Calculation Methods
Volume is calculated based on the selected tree species and the chosen method:
- Sopp volume table: a widely used, species-specific empirical method in Hungary.
- Schumacher–Hall equation: a regression-based model using height and diameter.
- Form factor method (Formzahlmethode): calculates volume from the product of diameter and height using a form factor.
- Allometric method: an ecological approach based on the relationship between diameter and height.
- Sequential log fitting on point cloud: divides the trunk into sections and fits a cylinder to each for precise volume estimation.
- Height and diameter determination only: simplified processing without volume estimation.
The calculation formula can be selected on the project upload interface.
Output and Visualisations
After tree inventory processing, the system presents results at multiple levels, both as data and visual outputs.
All data is automatically linked to the map and graphical views, making the project easy to explore in a clear, interactive format.
Summary Metrics
The project-level summary displays the following key values:
- Stem count
- Number of measured trees
- Total gross volume
- Average height
- Average diameter
- Average crown diameter
- Total basal area
- Parameters per hectare
Heat Maps and Charts
The system automatically generates several visual analyses:
- Tree height heat map
- Trunk diameter heat map
- Crown diameter heat map
- Tree height distribution chart
- Trunk diameter distribution chart
- Height vs. diameter correlation chart (with means and medians displayed in an interactive view)
All charts are interactive and expandable.
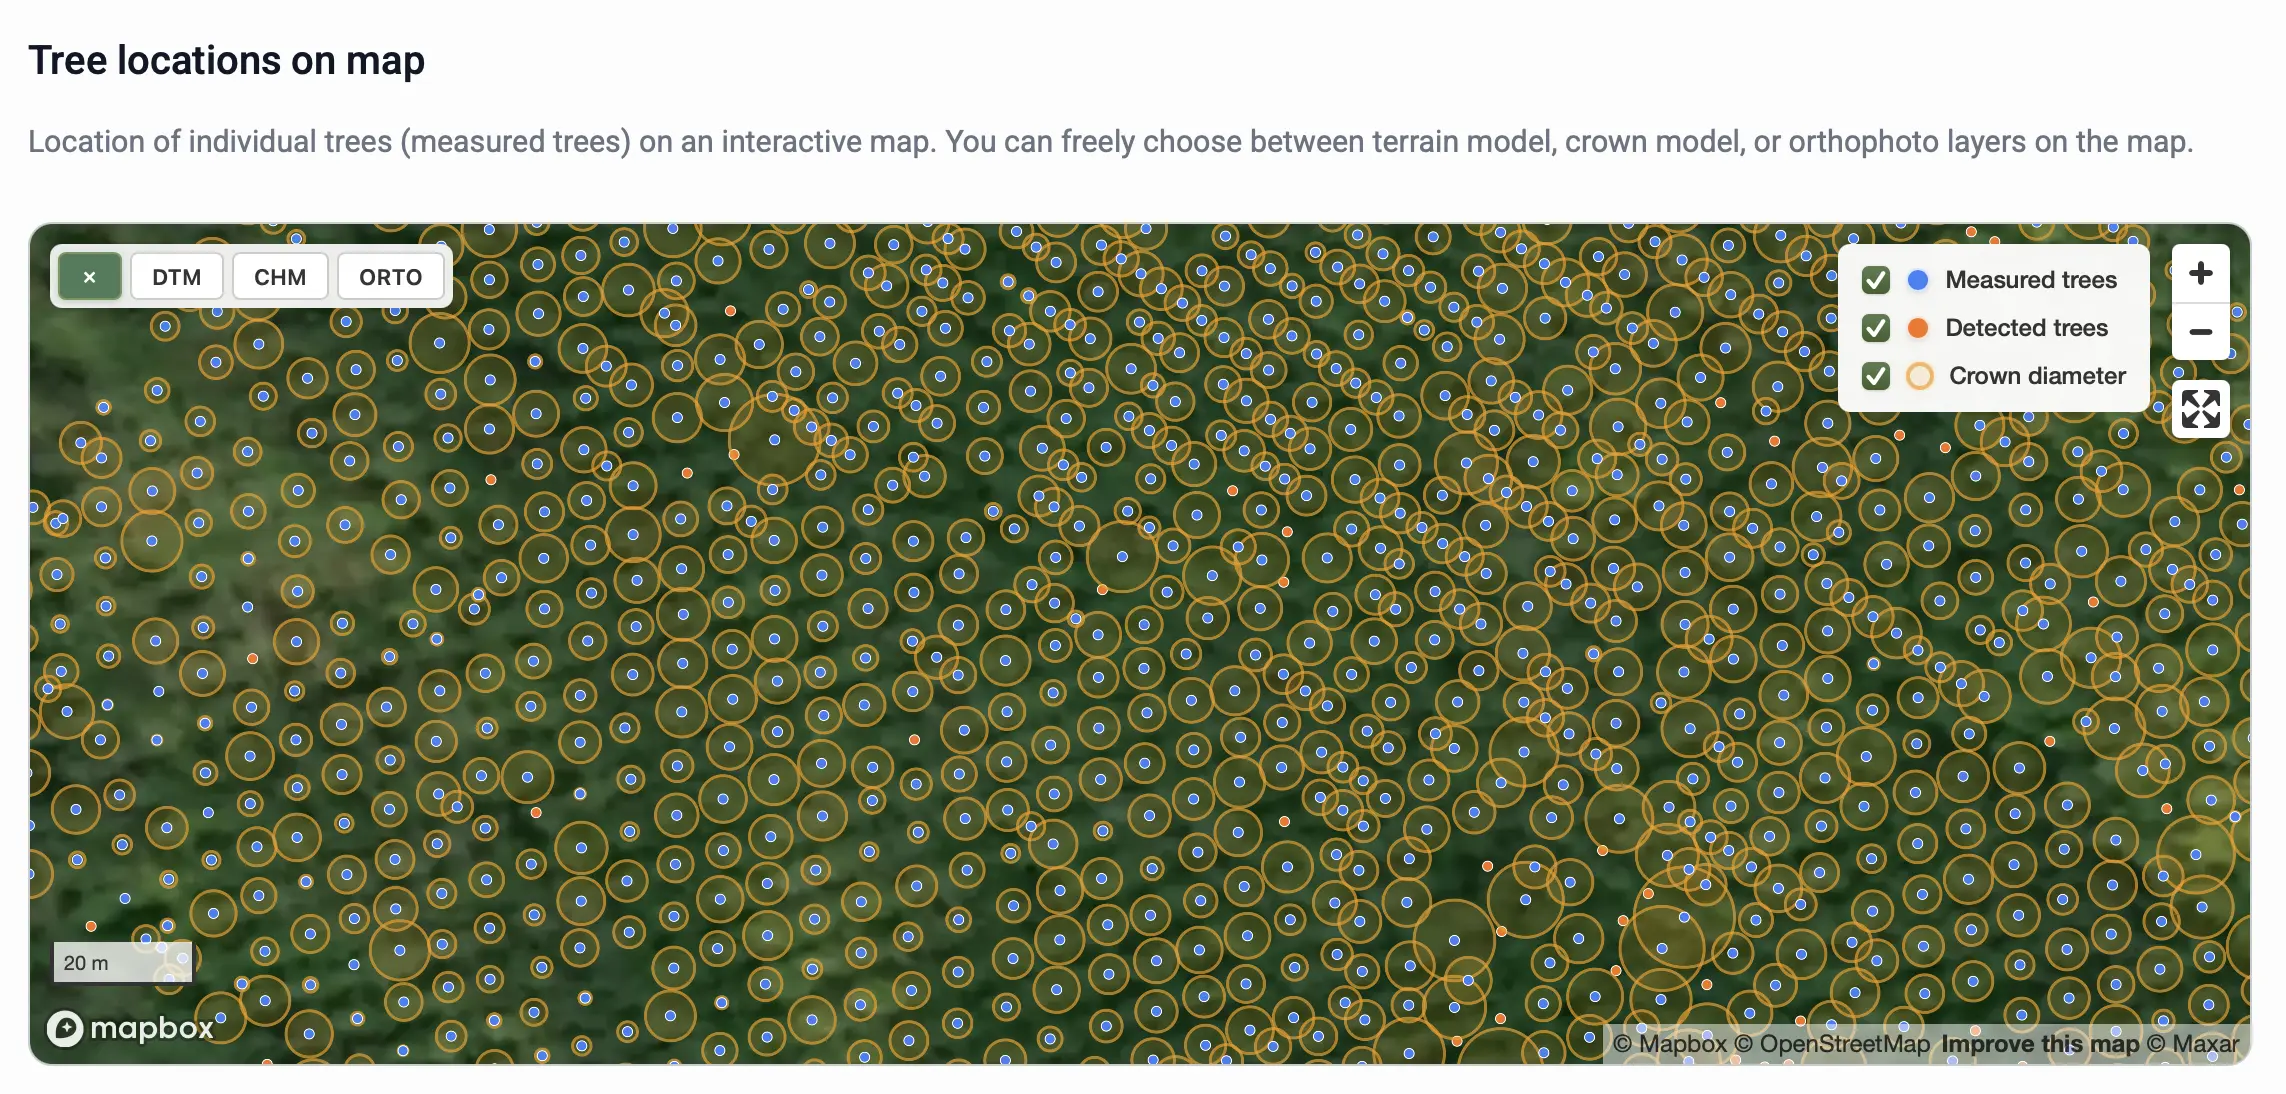
Interactive Maps
On the report page, tree locations are shown as map points.
Clicking on a tree reveals its main parameters:
- Height
- Diameter
- Crown diameter
- Volume
- Basal area
Switchable background layers on the map:
- DTM (Digital Terrain Model)
- CHM (Canopy Height Model)
- Orthophoto (for photogrammetric projects)
All raster layers are also downloadable as .tiff files.
Tabular Data
The processing output includes a detailed data table for every individual tree:
- TreeID (unique identifier)
- X, Y coordinates
- Fitting error (Error)
- Height (H)
- Diameter at breast height (D₁.₃)
- Crown diameter
- Gross volume (Volume)
- Basal area
- Species
- Area
- Detected tree count
The data table is downloadable in .xlsx format, and GeoJSON export is available for import into GIS software (e.g., QGIS).
LiDAR Demo Project Photogrammetry Demo Projectℹ️ Units
The system supports both metric (metres, centimetres, hectares) and imperial (feet, inches, acres) units. These are automatically applied based on your settings.
✅ Advantage:
The complete tree inventory is TreeDetect's most comprehensive service, delivering individually identifiable, spatially referenced, and measurable tree data.