Demo Reports
Demo reports provide an opportunity for anyone to explore how the system works and what the end result of processing looks like.
The reports show processed results from real projects, giving an accurate picture of the level of detail and the visualisations available in the system.
What Does a Report Contain?
Both demo projects illustrate the full results of the processing pipeline, including:
- summary statistics (stem count, volume, basal area, tree species, etc.),
- interactive map view of detected and measured trees with per-tree parameters,
- canopy height model (CHM), digital terrain model (DTM), and orthophoto layers,
- heat maps (height, trunk and crown diameter),
- distribution charts (height, diameter distribution and their correlations),
- interactive 3D point cloud viewer for the entire area and individual trees,
- and downloadable files (result table, layers, professional PDF report).
✅ Advantage:
By viewing the demo reports, users can see real-data results and understand what to expect from their own uploads.
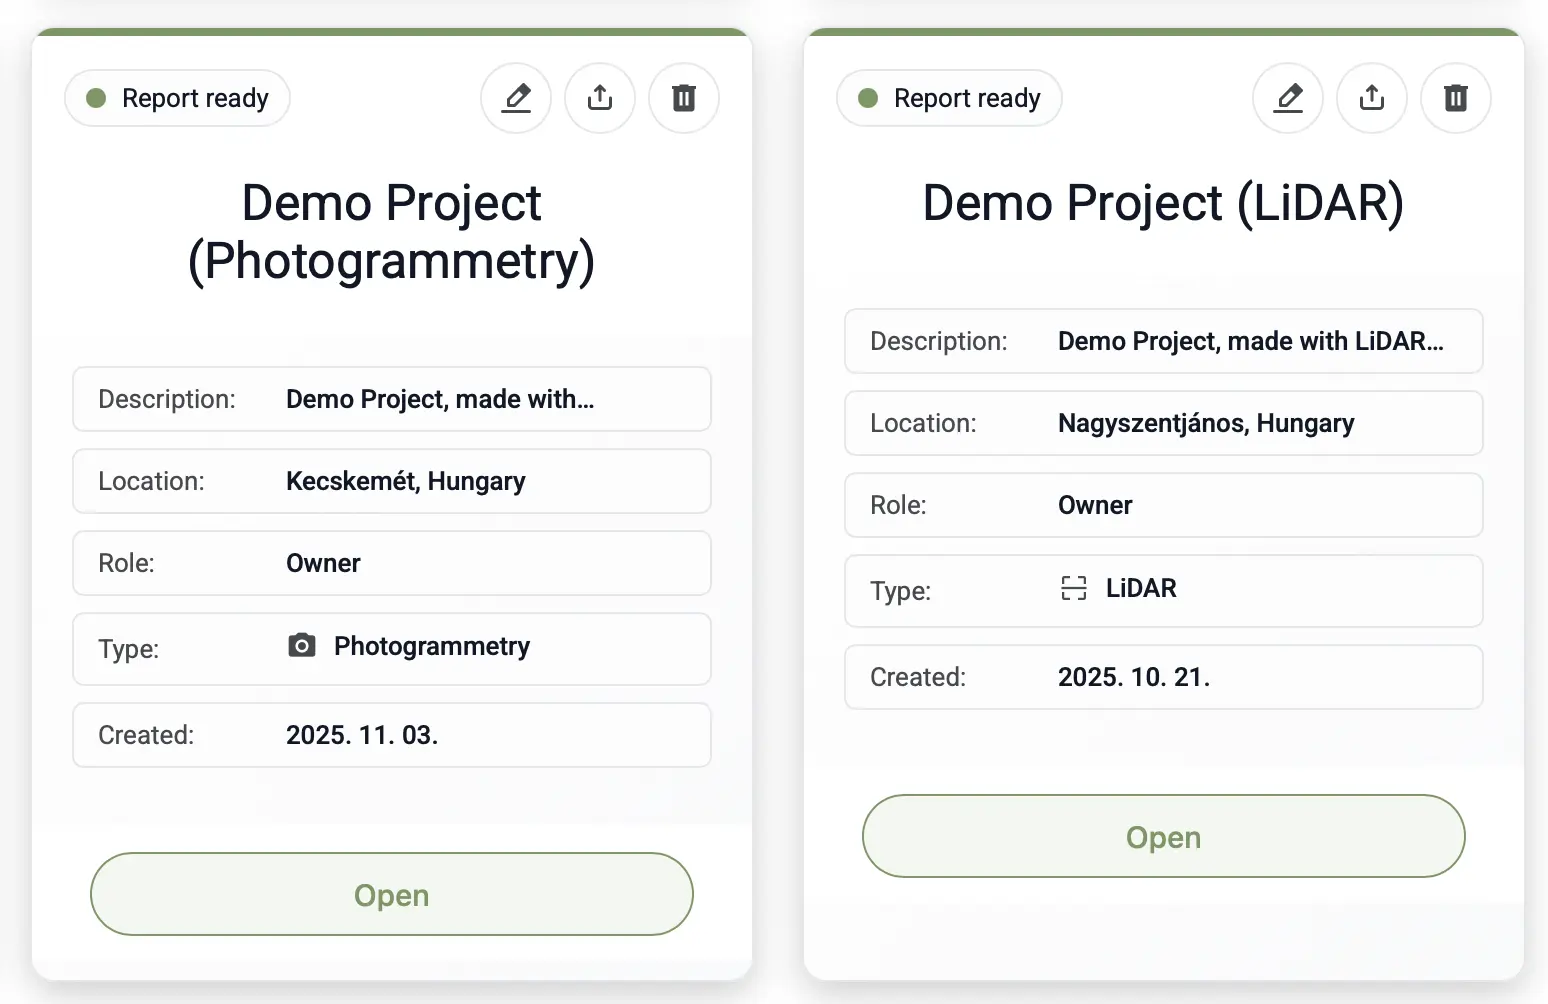
Available Demo Reports
The two projects below are fully accessible.
Each demonstrates a different data processing method.
LiDAR Demo Project
Detailed point cloud-based processing using high-precision LiDAR data.
A perfect example of visualising results from high-resolution, accurate 3D data.
Photogrammetry Demo Project
A project generated from a 3D point cloud based on high-resolution drone photos.
Demonstrates how the system processes image-based surveys and converts them into detailed forestry reports.